~/grkn/posts $ cat pingu-tr.md
Pingu.tr: Ping, MTR, Traceroute ve Browser Ping

- What is Pingu.tr?
- What is ping?
- What is traceroute?
- What is MTR?
- What is browser ping?
- Why did I make a tool like this?
I really love Pingu, and Tux too. Last year, I decided I should add another developer tool to the collection. But because of the projects I was working on, I never really had the chance. As AI tools have become a little more powerful every day, they created a window of time for me to work on a project. So I said it was time to make use of the pingu.tr domain name.
Pingu is our cute little penguin made of modeling clay. The one that shouts “Noot noot!” You surely know him. I guess there’s no one who doesn’t know Tux either. By the way, I feel closer to Tux; probably because of my belly, I don’t know. Let me give you another piece of information that won’t be useful: At one point, I changed the alert WAV file on the server monitor in the office. When the servers’ load values went up, it would start shouting “Noot noot!” ^.^
Let’s not stray from the topic. Pingu became a small network tool I put alongside my love of penguins.
What is Pingu.tr?
Pingu.tr is a network measurement tool. As its name suggests, its main job is to run ping tests. For this, I created probe servers from my own servers, across different networks. When you provide an IP address, Pingu.tr runs ping, traceroute and MTR tests through these probe servers.
Checking the same IP address from a different network can sometimes be important. Being unable to reach a server from your connection may not mean that the server is unavailable to everyone. The problem may be with your internet connection, a network in between, or the target server’s routing at a particular point. A single result does not show the whole picture.
Alongside these, Pingu also has a separate tool where you can test the stability of your own internet connection. The logic is simple: it sends requests to an address on Pingu—more precisely, Pingu endpoints behind Cloudflare—and measures latency and fluctuations in latency.
What is ping?
Ping is one of the basic network tests used to check whether you can reach a target and how long that round trip takes. The result usually appears in milliseconds. The lower the value, the lower the latency between the point where the test is run and the target.
For example, when you experience slowness while connecting to a server, ping would be one of the first things I would look at. If the target is completely unreachable, you may not get a response. If responses come through but the values keep changing, you get an indication about the stability of the connection. A one-off low or high value is not always enough; short-term fluctuations can be normal.
It would also be wrong to interpret a ping result directly as “the server is fast” or “the server is slow.” Ping measures the network; it does not, on its own, tell you how quickly the application produces a response. If a website opens slowly, the reason may be distance, the network route, server load, a database query, or the page itself.
Also, some systems may not respond to ping requests. Such a result does not necessarily mean that the target is down. That is why ping is an initial checkpoint, not a definitive diagnostic tool.
What is traceroute?
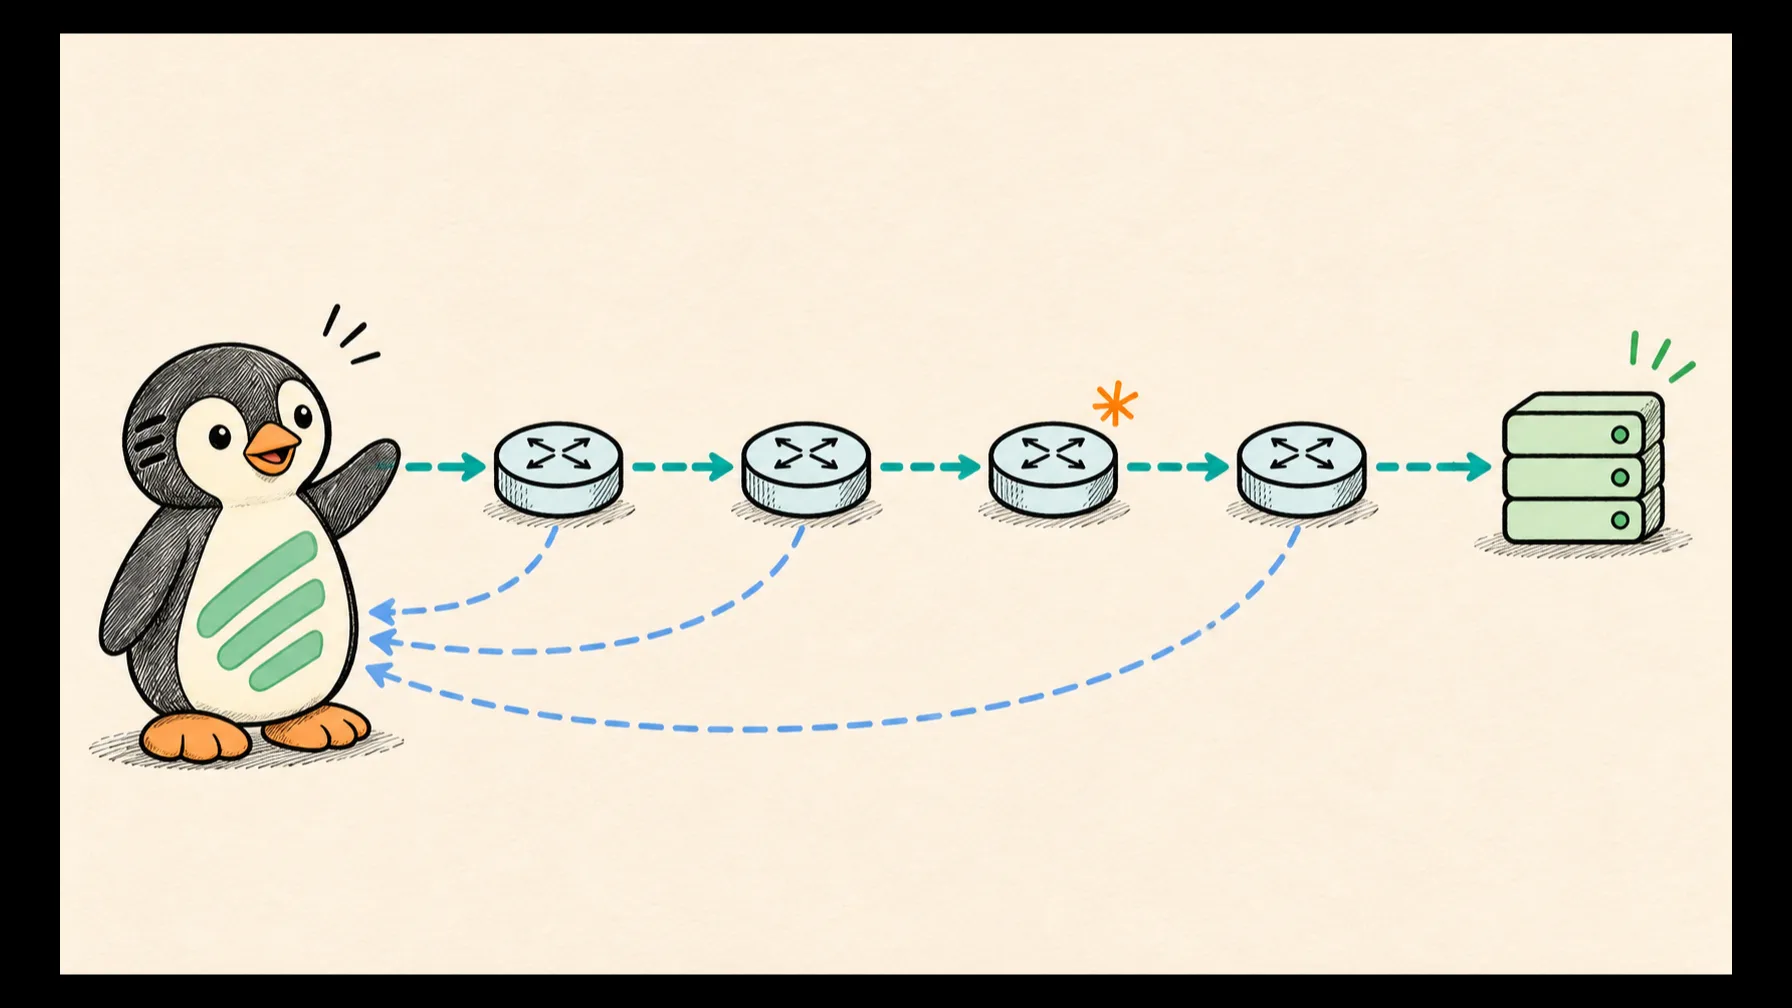
Traceroute tries to show the network points a request passes through on its way to the target. Ping tells you, “how many milliseconds did it take?” Traceroute, on the other hand, approaches the question, “which route did it take?”
When reaching a target, a request does not travel in a straight line through a single cable. It can pass through several different points among your internet service provider, backbone networks, routers, and networks close to the target. Each line in traceroute output represents a step along this route.
This output can be useful when you have an access issue with a site or server. If latency rises in the first few steps, the problem may be somewhere close to you. If it rises as it approaches the target, you need to look at latency in a different network. Of course, you should not treat this alone as a definitive conclusion.
Seeing asterisks in traceroute output does not directly mean there is an error either. Some network devices do not respond to these tests, while others may limit their responses. Even if one line in the middle of the route does not respond, if the following steps and the target respond properly, it would not be correct to say that real traffic loss is occurring at that point.

What is MTR?
MTR is a tool where ping and traceroute work together repeatedly. While showing the route to a target, it also tracks the latency of each step along the way and the variation seen throughout the test.
Traceroute is like a snapshot. Since MTR follows the same route for a while, it can be more useful for seeing fluctuations. Especially in intermittent connection issues, MTR can give a more meaningful picture while a single traceroute result looks normal.
Packet loss and latency values stand out in MTR output. But here too, there is no need to rush to a conclusion. If loss appears at a router in the middle while all following points and the target respond without issue, the device may simply be giving test packets low priority. If the loss is really affecting traffic, you would expect it to continue in the following steps as well.
I find MTR more useful especially for the question “how far does the issue continue?” rather than “is there an issue?” A rise that continues all the way to the target and an oddity in only one line in between should not be evaluated in the same way.
What is browser ping?
Browser ping is not an exact equivalent of a classic ping test. A request is sent from your browser to Pingu, and how long it takes for that request to receive a response is measured. So the value you see here is affected by the total of your device, Wi-Fi connection, internet service provider, and the route to Cloudflare.
The purpose of this test is not to measure your internet speed. It does not show download and upload capacity. It can be used more to see whether there is a noticeable latency fluctuation in your connection.
Especially when using video calls, gaming, or remote connections, a connection can sometimes feel annoying even though it appears fast. The reason is not always low speed; constantly changing latency can also disrupt the experience. The browser ping test exists to make this change more visible.
Ultimately, what is measured here is the route to Pingu and Cloudflare’s infrastructure. It does not explain every connection issue at home on its own. But it provides a quick starting point for seeing how consistently your connection is behaving at that moment.
Why did I make a tool like this?
Completely on a whim. You can find hundreds of tools like this on the internet. Pingu.tr is of course not a tool you have to use.
But when you want to check an IP address from different networks, see the route, or quickly check fluctuations in your own connection, I like having a few tools in one place. I already see these kinds of small tools as things you remember when needed but do not keep open all the time.
Still, you should see the mascot at least once. I think it turned out ridiculously cute ^.^
What does Pingu do differently?
For one thing, privacy is a priority for me. I do not even inspect the access logs of you visiting the website—unless there is an attack or bot traffic. Let’s put it that way—I do not keep a record in a database of who pinged whom. Everyone pings everyone, that’s cloud computing :) May you don’t understand the cloud computing joke - because you’re not living in Turkiye lol
Secondly, as I said, the mascot is ridiculously cute. I think if you are a sysadmin, devops person, or developer, it is a tool you can ping things with when you get bored. Because, while Pingu is running, it takes on different expressions based on the results.
If you wanted to use it, you can visit this url.